The purpose of Carlson (2026) Epidemiology of Injuries in Softball Pitchers: Does Pitch Count Matter? was to review the current research on injury rates in female fastpitch softball players, from youth through professional, and to discuss whether softball needs regulated pitch counts at every level. Megan Carlson, PT, DPT, of UW Health Sports Rehabilitation in Madison, Wisconsin, wrote it as a commentary in the HSS Journal, so there were no new participants or testing. Instead, she pulled together published studies on windmill pitching biomechanics, common pitcher injuries, injury rates in youth, high school, college, and professional softball, and pitching volume, and compared them with baseball. She also put Little League Baseball’s pitch count rules (a daily maximum by age, with required rest days based on pitches thrown) side by side with Little League Softball’s workload guidelines (innings-based for younger players, no official limit for ages 13–16). For context, more than 2 million female athletes played fastpitch softball in 2024.
The review found:
The Windmill Pitch Is Not a “Natural” Motion
- The shoulder and elbow experience similar amounts of torque in the windmill pitch as in the baseball pitch
- Some studies have found shoulder distraction forces near 100% of bodyweight
- The biceps is more active in the softball pitch than in the baseball pitch, resisting the arm being pulled out of the socket while bending the elbow
- The long head of the biceps and the superior labrum are at particular risk
- Anterior (front of the) shoulder pain is among the most common complaints
- Pitching from flat ground (no mound) requires significant power from the hip muscles, and not enough hip power can lead to overreliance on the shoulder and elbow
The underhand motion still puts baseball-level stress on the arm.
Shoulder Injury Rates Are Close to Baseball’s
- Oliver et al. (2019), U.S. high school softball, 2005–2006 through 2016–2017: 239 shoulder and 85 elbow injuries in more than 2 million athletic exposures (AEs)
- Shoulder: 1.14 per 10,000 AEs
- Elbow: 0.41 per 10,000 AEs
- Saper et al. (2017), high school baseball: shoulder 1.39 and elbow 0.86 per 10,000 AEs
- About half of the softball shoulder and elbow injuries were overuse or chronic; the most common were muscle strains and tendinitis
Elbow injuries are less common in softball, but the shoulder gets hurt at close to baseball’s rate.
Pitchers Carry the Overuse Burden
- Share of injuries that were overuse or chronic:
- Softball: pitchers 60.8% vs position players 49.2% (Oliver et al., 2019)
- Baseball: pitchers 48.3% vs position players 24.5% (Saper et al., 2017)
- Softball pitchers have more than double the risk of an upper extremity injury compared to position players
- Smith et al. (2015) followed 98 youth players (48 pitchers, 50 position players):
- Cumulative injury incidence was 40%
- 38% of pitchers had injuries directly related to pitching, and 61% of those involved the shoulder
- Pitchers had more than double the risk of an injury lasting longer than 2 weeks
A bigger share of softball pitchers’ injuries are overuse injuries than in baseball pitchers.
Every 100 Pitches Adds Up (KEY FINDING)
- Patel et al. (2021) followed professional softball pitchers for one season
- For every additional 100 pitches thrown during the season, pitchers were 5% more likely to sustain an injury
- Injured pitchers threw 967 more pitches during the season than uninjured pitchers
- The author noted that research on how unregulated pitch counts affect injury risk in softball is still limited
Pitch volume matters in softball, too, and it adds up over a season.
Softball Has No Real Pitch Count Rules
- Little League Baseball has mandated game pitch counts and rest days since 2010
- Example: a 9–10 year-old has a daily max of 75 pitches, with 4 days of rest required after 66 or more
- Little League Softball:
- Ages 12 and under: up to 12 innings a day, with no pitch count
- Over age 12: no pitching restrictions
- The Sports Trauma and Overuse Prevention (STOP) Injury Campaign offers softball pitch count and rest recommendations, but they are not consistently used
- College:
- Baseball pitchers (ages 19–22) are recommended to throw no more than 120 pitches per game with 5 days of rest
- In one study, college softball pitchers averaged 168 pitches (bullpen plus game), with no rest guidelines
The sport with similar shoulder injury rates has far looser rules.
Small Staffs Mean Big Workloads
- A softball roster carries 1 to 4 pitchers; a baseball team may carry as many as 17
- Youth pitchers may throw as many as 90 pitches in a game and approach 1,000 pitches in a 3-day tournament
- Many adolescent players play a club schedule on top of high school, so year-round play is common
- High pitch counts lead to decreased range of motion and strength, and fatigue can alter mechanics
Fewer arms means each pitcher’s count climbs fast, especially on tournament weekends.
The Early Season and Reinjury Are Danger Zones
- In Smith et al. (2015), most youth injuries happened in the first 6 weeks of the season
- Arm care and injury prevention programs are less common in softball than in baseball
- Rauh et al. (2007) reported a 2- to 3-fold risk of reinjury within one high school softball season
- Most softball injuries do not cause significant time loss, but the risk of getting hurt again that season is high
Preseason buildup and full recovery before returning are where coaches can make a difference right now.
Implications: Carlson concluded that the windmill pitch is a complex, full-body movement that requires immense coordination and strength, and that the forces on the arm, especially at the shoulder, are significant. The idea of the windmill as a “natural motion” has been largely disproven, but it still shapes softball culture, especially how much pitchers throw. Because the joint stresses and injury rates are comparable to baseball’s, she argued it is reasonable to infer that monitoring pitch counts in softball, as baseball requires, could decrease overuse injuries, and that pitch count regulations should be established and monitored. She named likely risk factors for youth pitchers: a lack of preseason preparation, an inappropriate or absent interval throwing program, and not monitoring pitch counts, especially early in the season. The high reinjury risk may also point to training errors or not enough rest and rehabilitation. Limitations: this is a commentary that summarizes other studies, not new data. Research on softball injury rates is limited, and research on pitch volume and injury is even more limited; the direct pitch-count evidence comes from one season of professional pitchers. High school data also capture only part of the year, since many players also play club softball. She called for more research on pitch counts in softball players.
Key Takeaways
- Count every pitch, including bullpens. In professional pitchers, each extra 100 pitches in a season made an injury 5% more likely.
- Don’t trust the “natural motion” myth. Softball shoulder injury rates are close to baseball’s.
- Build up before the season. Most youth injuries happened in the first 6 weeks, so use a gradual throwing progression.
- Plan tournament weekends. With 1 to 4 pitchers on a roster, a youth arm can approach 1,000 pitches in 3 days.
- Finish the rehab. Reinjury risk was 2 to 3 times higher within the same high school season.
Important Biomechanics Connection
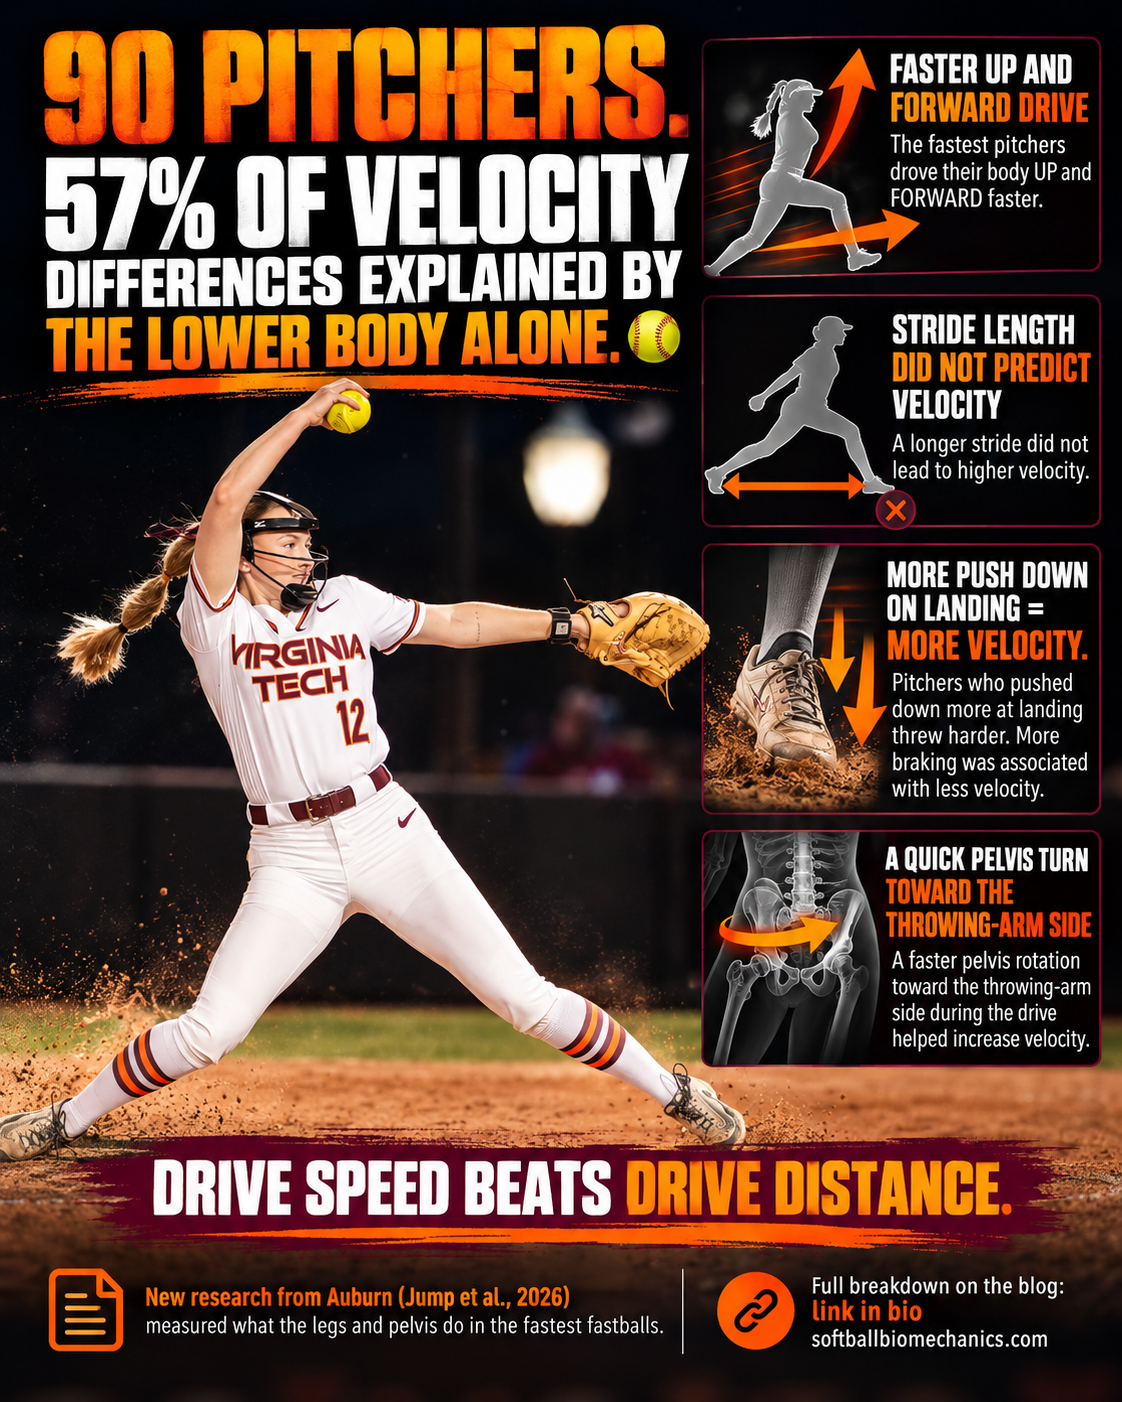
This review ties together a lot of what we’ve covered here on fatigue and workload. Shanley et al. (2012) looked at shoulder range of motion, pitch count, and injuries in high school pitchers (March 20, 2025), and Shanley et al. (2011) compared injury rates in high school softball and baseball players (October 30, 2025). Talmage et al. (2023) tracked range of motion changes over a simulated game (December 26, 2024), Pletcher et al. (2021) followed drive-leg force across consecutive pitches (February 13, 2025), and Oliver et al. (2021) looked at biceps tendon changes in youth pitchers (July 9, 2026), which fits Carlson’s point that the biceps and the front of the shoulder take a beating. Her point about flat-ground pitching also fits the kinetic-chain model: without a mound, the hips have to produce the power, and when they don’t, the shoulder and elbow pick up the slack. That’s the same lower-body message as Jump et al. (2026), covered here on October 15, 2026. And it’s a new twist on softball ≠ baseball. The mechanics are different, but the arm stress and shoulder injury rates are similar, and only baseball has pitch count rules. Until softball catches up, counting pitches is up to coaches, parents, and pitchers.
Also…
This year’s World Series put two small-market teams on the big stage: the Milwaukee Brewers and the Tampa Bay Rays. Their payrolls are $154.7 million and $112.9 million (per Cot’s Contracts), and the Brewers beat the Dodgers in the NLCS while being outspent nearly 3 to 1 (Sports Illustrated). Neither team can buy a title, so both lean on analytics, great coaching, and the details, like bullpen management and pitch arsenal tweaks between games (MLB.com’s preview). Watch and learn. Science is how you compete when you can’t outspend anyone, and it’s worth noticing how both teams handle their pitchers’ workloads.
Newsletter subscribers got this review a week early. Sign up for the Pitch Better Newsletter to get each week’s research first.